What is Power BI and when is it worthwhile?
Business intelligence for companies – Power BI advantages
Business intelligence for companies – Power BI advantages
Microsoft Power BI has been recognized as a leader in analytics and business intelligence (BI) in the Gartner Magic Quadrant for the 14th consecutive year. Today, every second company in this sector relies on Microsoft. But what benefits does Power BI offer SMEs, and what makes this solution stand out?
What is Microsoft Power BI?
Power BI, the business intelligence solution fully integrated with Microsoft Dynamics 365 Business Central, is an intuitive platform offering numerous components for comprehensive modeling and real-time interactive analysis.
Microsoft Power BI is business analytics software that transforms data into actionable insights and makes them accessible to the right people in your organization. How does it benefit you? It provides the insights you need to make informed decisions.
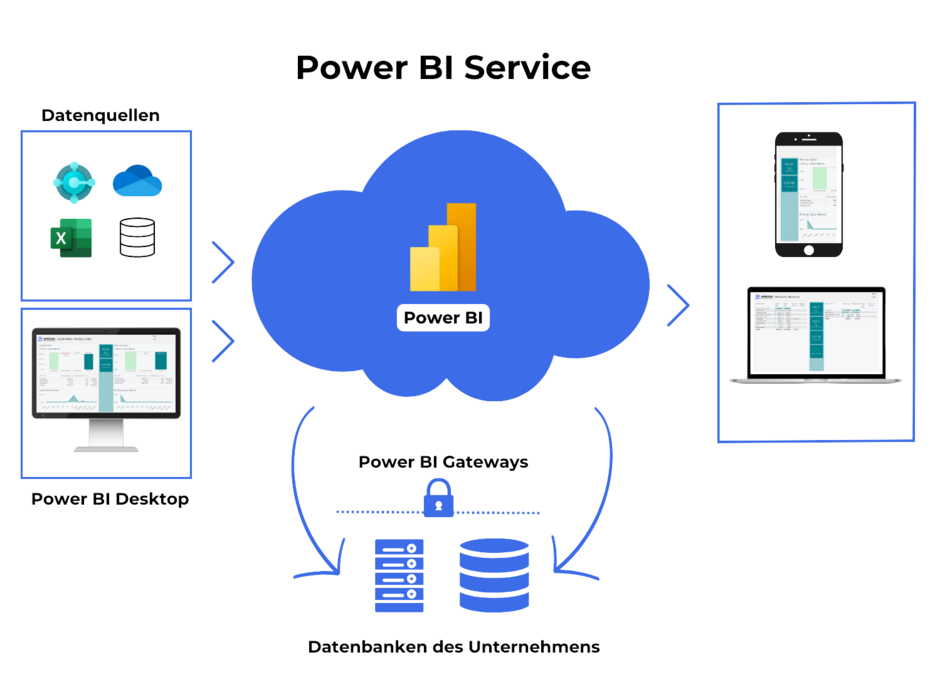
With Power BI, you can create interactive data visualizations from multiple sources and share key business insights across your organization. Dashboards, reports, and visuals can be displayed on end devices via a web page, the Power BI app, or directly within your ERP system. Hundreds of data sources and connectors are available, enabling you to create meaningful, visually appealing evaluations.
What are the advantages of Microsoft Power BI for businesses?
Discover the many benefits of Power BI in the sections below.
Power BI offers simple, integrated functionality
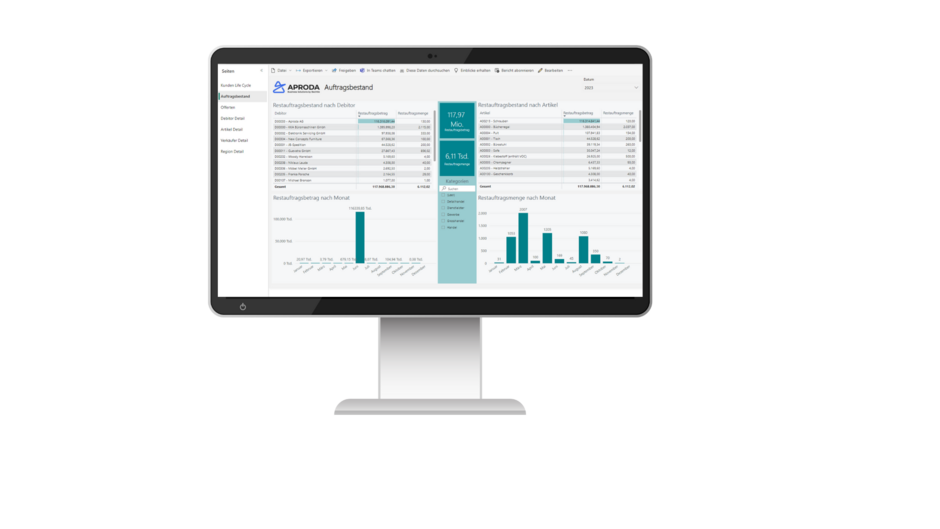
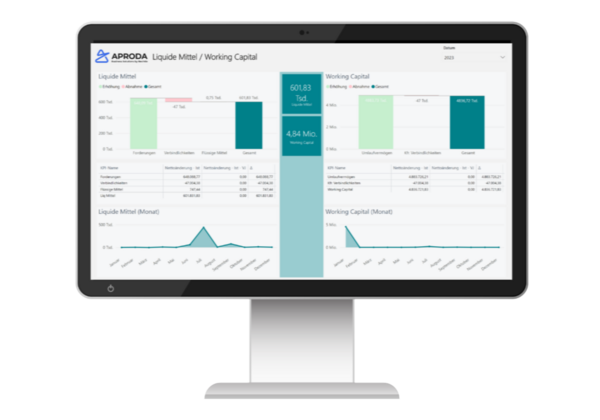
With the Power BI reporting tool, you can easily provide a clear overview of your most important business data and key figures. Track data such as sales, margins, contribution margins, inventory, and resource utilization at the touch of a button—giving you a constant overview.
Power BI stands out for its user-friendly and intuitive design. Implementation is straightforward, even for SMEs. It can be used as a standalone solution or embedded into Microsoft Dynamics applications such as Business Central or Dynamics CRM. With Power BI, you can create reports precisely tailored to your needs (e.g., an article list).
With Power BI, you can design your own report
Power BI offers a wide range of visualizations, many of which are familiar from Excel and can be used intuitively.
Power BI takes care of your report layout
Power BI applies your corporate identity to the design of your reports. For number crunchers who struggle with creating attractive layouts, Power BI provides various design support options. Even without specific instructions, it ensures a high-contrast color scheme.
If you want reports to consistently reflect your company’s CI, it’s best to define the CI once in a specific design template. This way, all newly created reports in Power BI can automatically use the predefined layout.
Power BI delivers and processes data in real time
In Power BI, data is processed immediately, and dashboards update automatically. If you want to be notified when a KPI exceeds a defined threshold, you can set up data alerts for gauges, KPIs, and maps.
Power BI controlling helps you maintain an overview
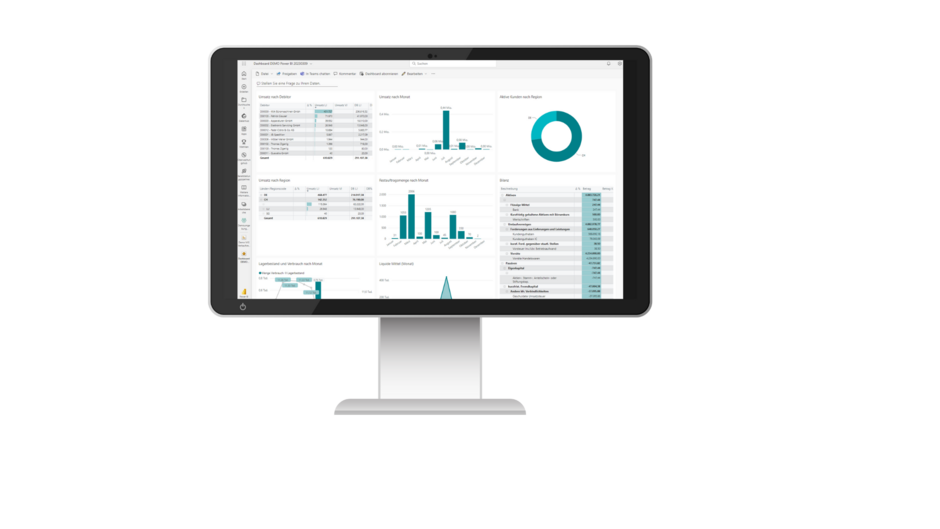
With the modern Power BI dashboard, you can monitor key processes and figures in a single application. Thanks to its powerful data analysis, negative trends can be quickly identified and addressed in reports.
Power BI provides data to aid decision-making
Simple interactions in Power BI make querying data effortless. Your employees benefit from its simplicity, clear visualizations, and process-oriented presentation of the required information—helpful when making important decisions.
Another highlight of Microsoft Power BI is the ability to analyze deviations directly from graphs. Increases and decreases over time are automatically evaluated, and Power BI can even use correlated values to suggest possible explanations.
With Power BI, you can find out how your reports are being used
Power BI automatically generates statistics based on usage metrics, allowing you to see, for example, how a particular report ranks. This helps your team identify reports that are rarely used and critically assess whether they should be retained.
How and where to use Power BI
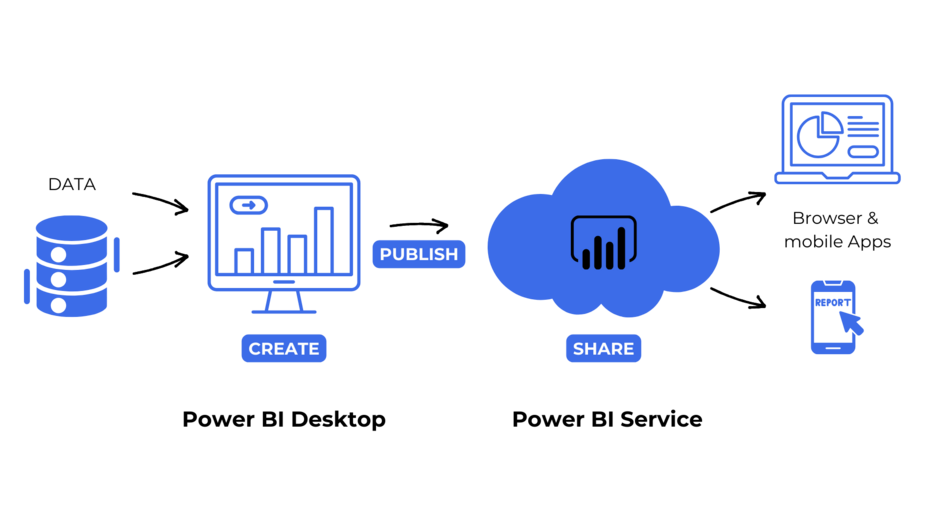
Power BI Desktop
In Power BI Desktop, data modeling takes place in the background. This version offers the most comprehensive functionality and is typically used by experienced Power BI users or implemented directly by Aproda before being published in Power BI Service. Alternatively, reports can also be published directly to the report server (on-premises).
Power BI Service
End users access Power BI Service by logging in online. The tool is available from anywhere, ensuring your employees always have the same up-to-date information. Your data remains current thanks to regular updates, such as overnight refreshes.
Power BI mobile
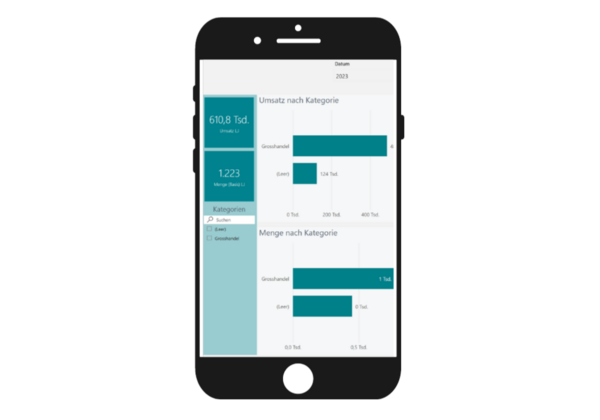
With Microsoft Power BI Mobile, you can keep track of key data in your dashboards even while on the go. Applications and visualizations from Power BI are accessible anytime through the mobile app on your device. Reports and dashboards can be optimized for tablets as well as specifically adapted for phone layouts (portrait format instead of landscape).
You can also set up notifications for defined deviations, enabling you to react quickly—no matter where you are.
How does data transfer to Power BI work?
Microsoft Dynamics 365 Business Central can serve as a data source, for example. Data is transferred to Power BI via an interface, and in principle, all data from Business Central can be analyzed in Power BI.
When connecting databases, users are guided through the process of selecting the right one from a list of standardized sources and connectors. During data modeling, a network diagram can be generated to map dependencies (e.g., 1:n relationships).
These are the most important features of Power BI
Consistent use of key figures
Power BI gives you a comprehensive overview of sales, purchasing, warehousing, and finance. Each business area can be analyzed in detail and individually.
The Power BI interface provides an at-a-glance view of your most important key figures. Power BI serves as the central hub for all your business data—everything stored in one place.
Connection of various ERP systems
Business Intelligence enables the setup of various dimensions in Power BI, including industry-specific ones.
Power BI processes your data multidimensionally and can connect to multiple ERP systems, such as Microsoft ERP, Dynamics NAV, Navision, SAP, Abacus, or other third-party tools. This capability is a key advantage, as it allows you to combine data from different sources and make truly data-driven decisions.
Flexible design for dashboards and reporting
All your reports can be designed flexibly—both in terms of layout and content. You can display results on your devices using different chart types (visuals), insert columns for year-on-year comparisons, or organize reports in a personalized favorites collection.
Visualisations
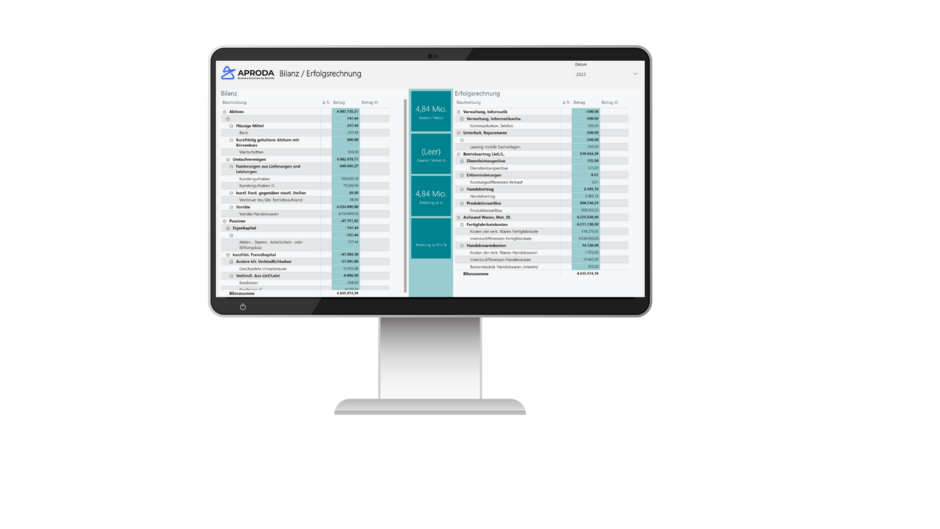
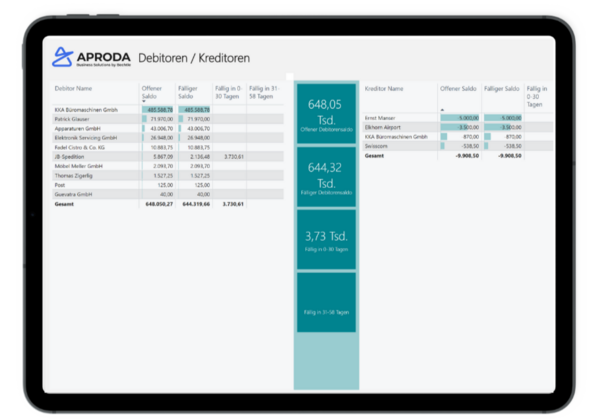
With Power BI, you can create compelling data visualizations in no time—for example, for metrics such as turnover, sales volumes, product categories, contribution margins, and even accounting topics like accounts receivable/payable, balance sheets, and income statements.
Interactive analyses
Microsoft Power BI is an interactive business intelligence tool that helps companies visualize data. With Power BI, you can create comprehensive, interactive dashboards and reports. Hundreds of data sources and connectors are available to support your analysis.
These analyses allow you to generate meaningful, visually appealing results that provide valuable insights—helping you make informed decisions and drive business growth. Power BI’s custom visualizations and interactive dashboards give you a consolidated, real-time view of your business data—optimized and tailored to your role.
Forecasting
Power BI software is a business analytics tool that provides insights into all areas of your organization at the touch of a button. It gives you a unique 360-degree view of your business. With this foundation, you can perform analyses, identify trends, and generate forecasts. Power BI supports you in planning and decision-making across your organization.
Guided processes
Power BI helps you create reports from start to finish. Users are guided through the process right from selecting the data source. During data modeling, a network diagram can be generated to map dependencies (e.g., 1:n relationships).
The creation of quick measures is also simplified by the system, which offers a wide range of frequently used formulas to choose from. This means you benefit from a guided process with contextual help when creating reports.
Power BI service
The Microsoft Power BI Service (https://app.powerbi.com) is part of Power BI’s Software as a Service (SaaS) offering. With Power BI Service, you can access and interact with reports and individual visual elements directly in your browser.
Power BI and Office 365
Thanks to seamless integration, valuable company data can be accessed directly within your Microsoft 365 apps. This saves time, enables informed decision-making, and allows you to share data and insights with your team instantly.
Conclusion on Power BI
Power BI is a platform-independent business analytics solution that transforms data into actionable insights and makes them accessible to the right people in your organization. With Power BI, you can create interactive, comprehensive dashboards and reports, gain valuable insights, make informed decisions, and drive business growth.
Dashboards and reports can be displayed as web pages, in the Power BI app, or directly within your ERP system. Hundreds of data sources and connectors are available, enabling you to create meaningful and visually appealing evaluations.
The principle behind Power BI simplifies business processes, saves time, and helps you identify trends early. Data is available in real time at the touch of a button, giving you a unique 360-degree view of your organization.
Aproda AG’s Power BI reporting solutions can be implemented and ready to use in a short time. You can manage access and permissions for your team or individual users directly in Power BI with minimal effort.
Do you have any questions about Power BI’s components? Feel free to contact us.
Frequently asked questions (FAQ) about Power BI
What are the main features of Power BI?
Power BI offers a wide range of features that help businesses analyze and visualize data. These include interactive dashboards, real-time data analysis, custom visualizations, and extensive reporting capabilities. With Power BI, businesses can transform both simple and complex data into clear visualizations and gain deeper insights into their processes.
How can companies integrate Power BI into their existing IT infrastructure?
Power BI can be easily integrated into existing IT environments thanks to its compatibility with a wide range of data sources and systems. Companies can connect Power BI to Microsoft products such as Excel, Azure, and SQL Server, as well as third-party tools. Aproda ensures seamless integration of Power BI into your infrastructure, guaranteeing smooth operation.
How does Power BI help automate business processes?
Power BI automates business processes by processing and visualizing data in real time. You can set alerts and notifications based on predefined thresholds, enabling immediate action when critical events occur. This accelerates decision-making and reduces manual tasks.
Which industries benefit most from Power BI?
Power BI delivers value across nearly all industries, including financial services, healthcare, retail, manufacturing, and more. Every sector can benefit from flexible data analysis and the ability to gain insights into specific business data—enabling informed, data-driven decisions.
How does Aproda support companies in using Power BI?
Aproda provides end-to-end support for implementing Power BI—from analyzing your data requirements to creating customized dashboards and reports. We also train your employees to use Power BI efficiently and offer ongoing support to ensure long-term success.
Patrick Glauser | Head of Sales, Member of the Executive Board
Then I will be very happy to advise you personally. Give me a call: 058 200 14 14 or book a consultation with me directly. I look forward to hearing from you!
Contact us