Microsoft Power BI: Real-time data analysis.

When it comes to data analysis, Microsoft Power BI is the leading BI solution for enterprises, according to the Gartner Group. What benefits does this standard reporting tool generate for your company? Power BI software is a business analytics tool that gives you insights into all areas of the organization at the touch of a button.

This allows easy connections with different data sources and provides a unique 360 degree view of your business. With this basis the analysis, as well as the derivation of trends and predictions is possible and supports you in planning and decision making in your business.

The advantages of Power BI

  • Uniform use of key figures
  • Multidimensional data analysis through business intelligence
  • Flexible design for dashboards and reporting
  • Connection of different ERP systems (Microsoft ERP, MS Dynamics NAV, Navision, SAP, Abacus or others)
Gartner Studie mit power bi surface

3 Good Reasons for Power BI

quick & easy implementation

The reporting solutions from Aproda AG are implemented and ready for use within a short period of time. In addition, a tool can already be purchased for a low investment.

intuitive operation - flexible solution

The simplicity and breadth of basic functionality allows you to quickly make changes and expand reports and dashboards and export them to Excel.

real-time data at the touch of a button

Integrated control and security: At the touch of a button, data is retrieved in real time, giving you a unique 360-degree view of the business.

The advantages of Microsoft Power BI

  • Key performance indicators at the push of a button
    Create comprehensive reports - no matter the time and place. Track your data such as sales, margin, DB, inventory and resource utilization at the touch of a button
  • Controlling 
    Monitor important processes and figures with our modern dashboard. This allows negative trends to be quickly identified and addressed.
  • Mobility
    With Microsoft Power BI, you have an overview of your data, even when you are on the road. In case of defined deviations, you will receive a message and can react quickly. 
  • Visualize data & details
    Custom visualizations and interactive dashboards give you consolidated live views of your business data - tailored to you.
  • Data as a decision-making aid
    With simple interactions, querying becomes a breeze and your employees benefit from the simplicity, visualization and process-oriented data presentation. 
  • Data as a decision-making aid
    With simple interactions, querying becomes a breeze and your employees benefit from the simplicity, visualization and process-oriented data presentation. 
Gartner Study
2021
„Microsoft Power BI Positions Itself as a Leader in the Gartner 2018 Magic Quadrant for Analytics and Business Intelligence Platforms.“

The Application Areas of PowerBI at a Glance

Power BI for business processes

Microsoft PowerBI can be used to analyze all of...

Power BI for business processes
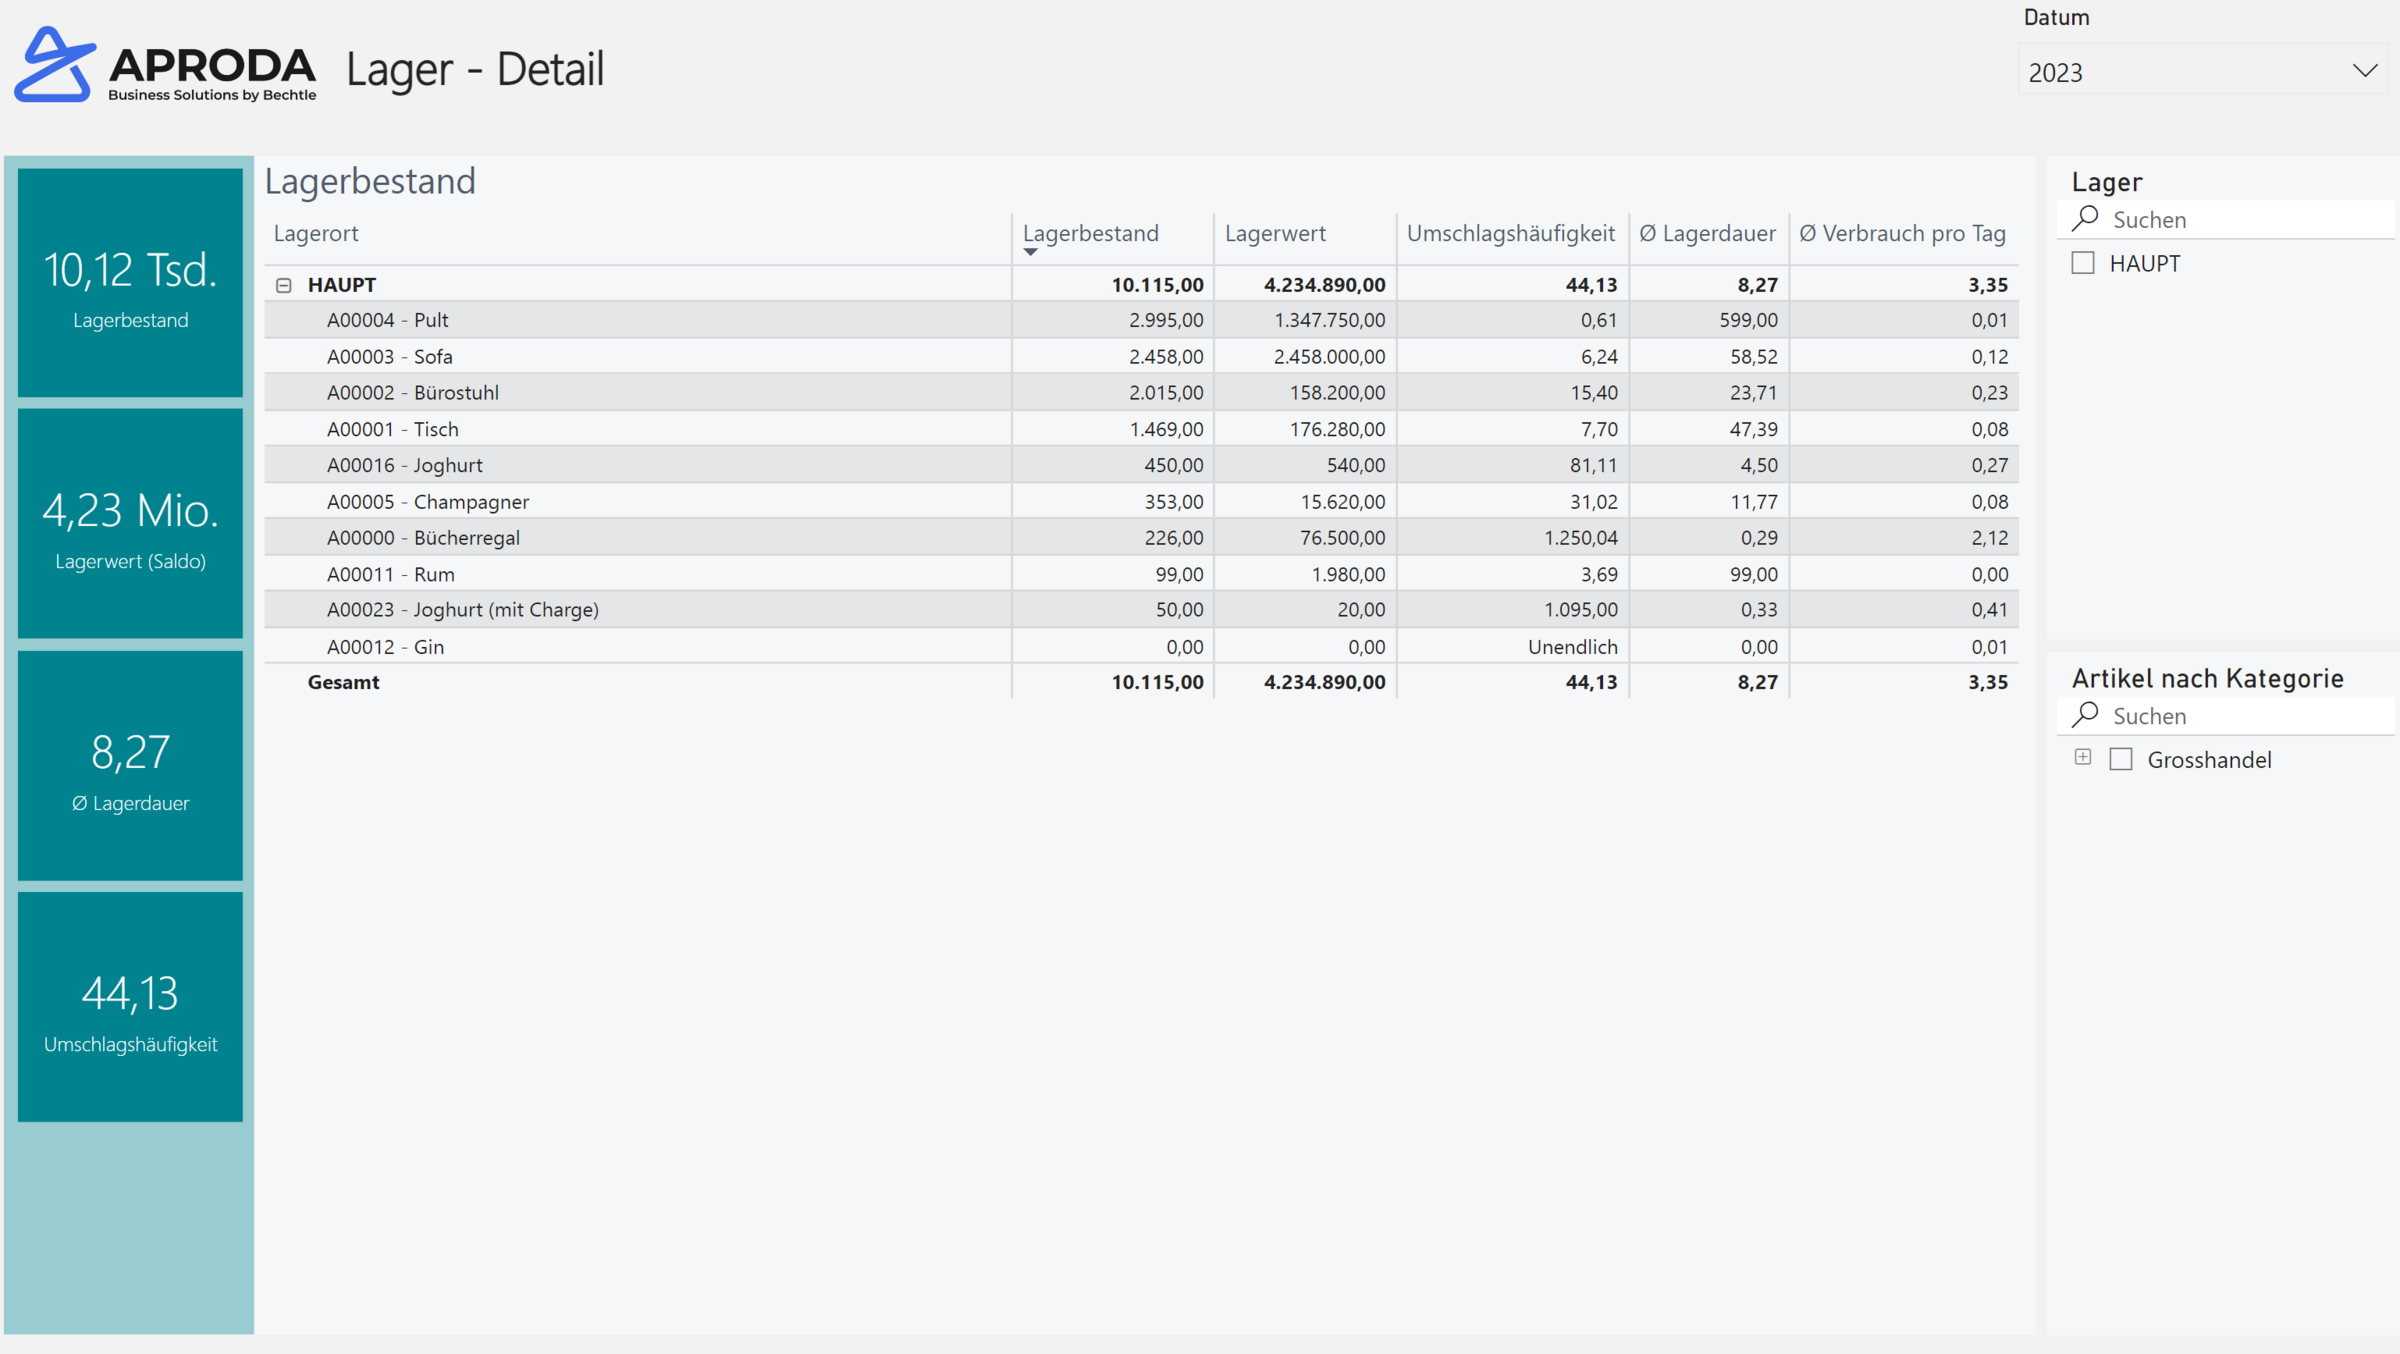
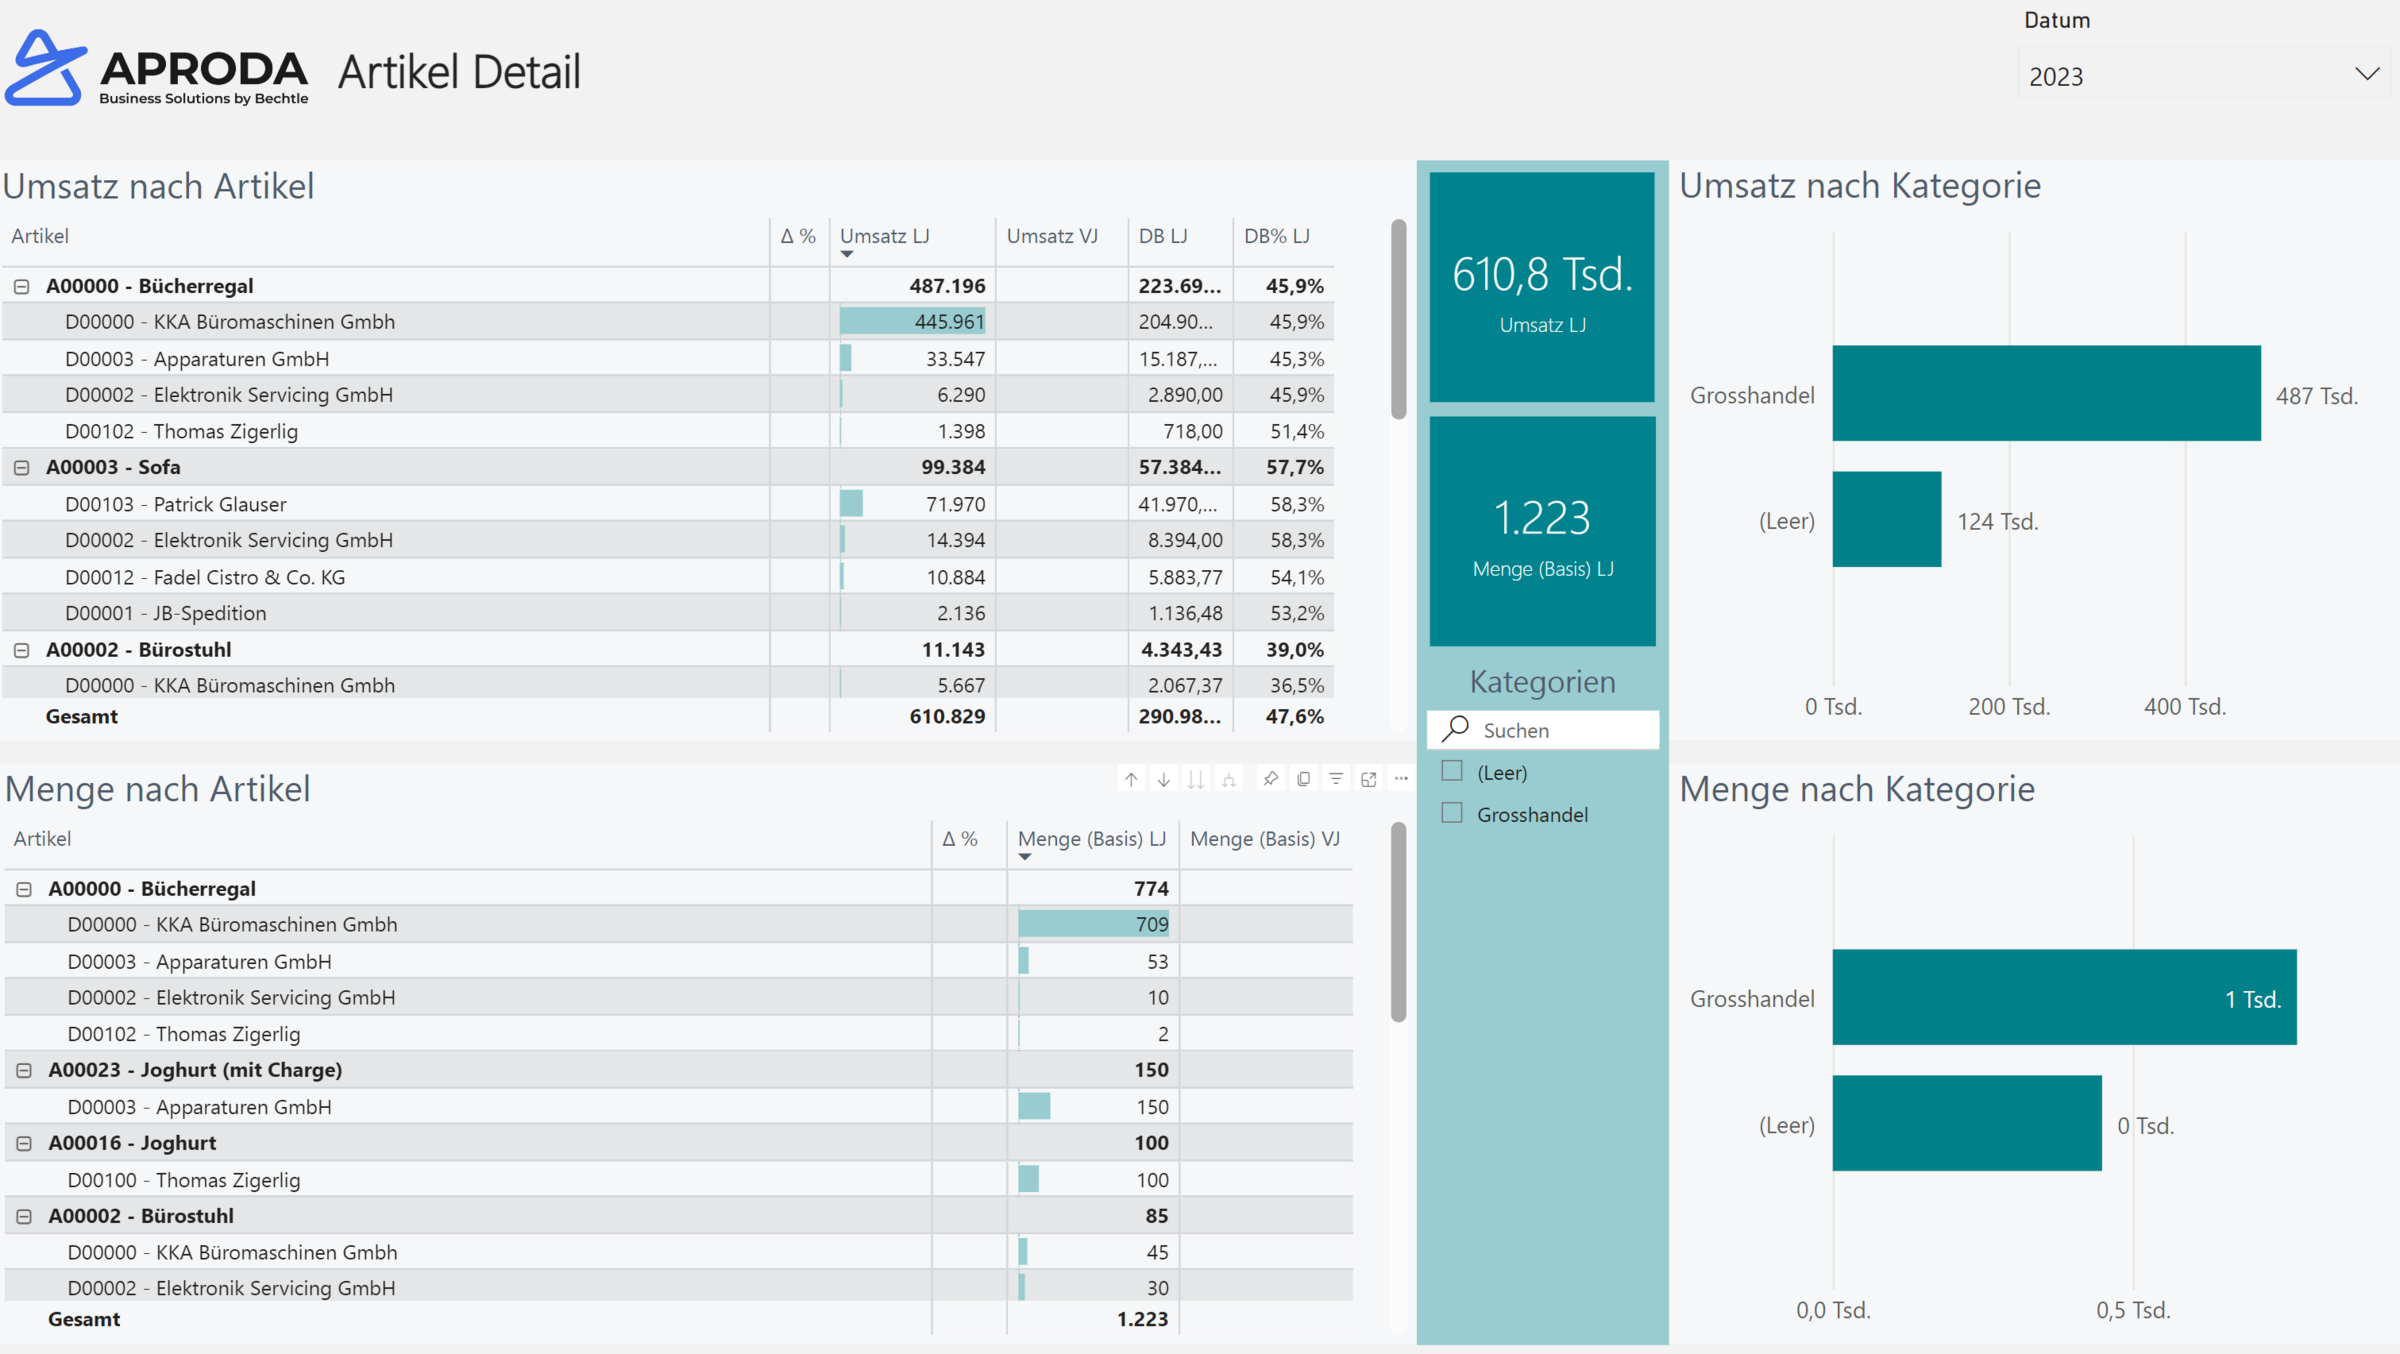
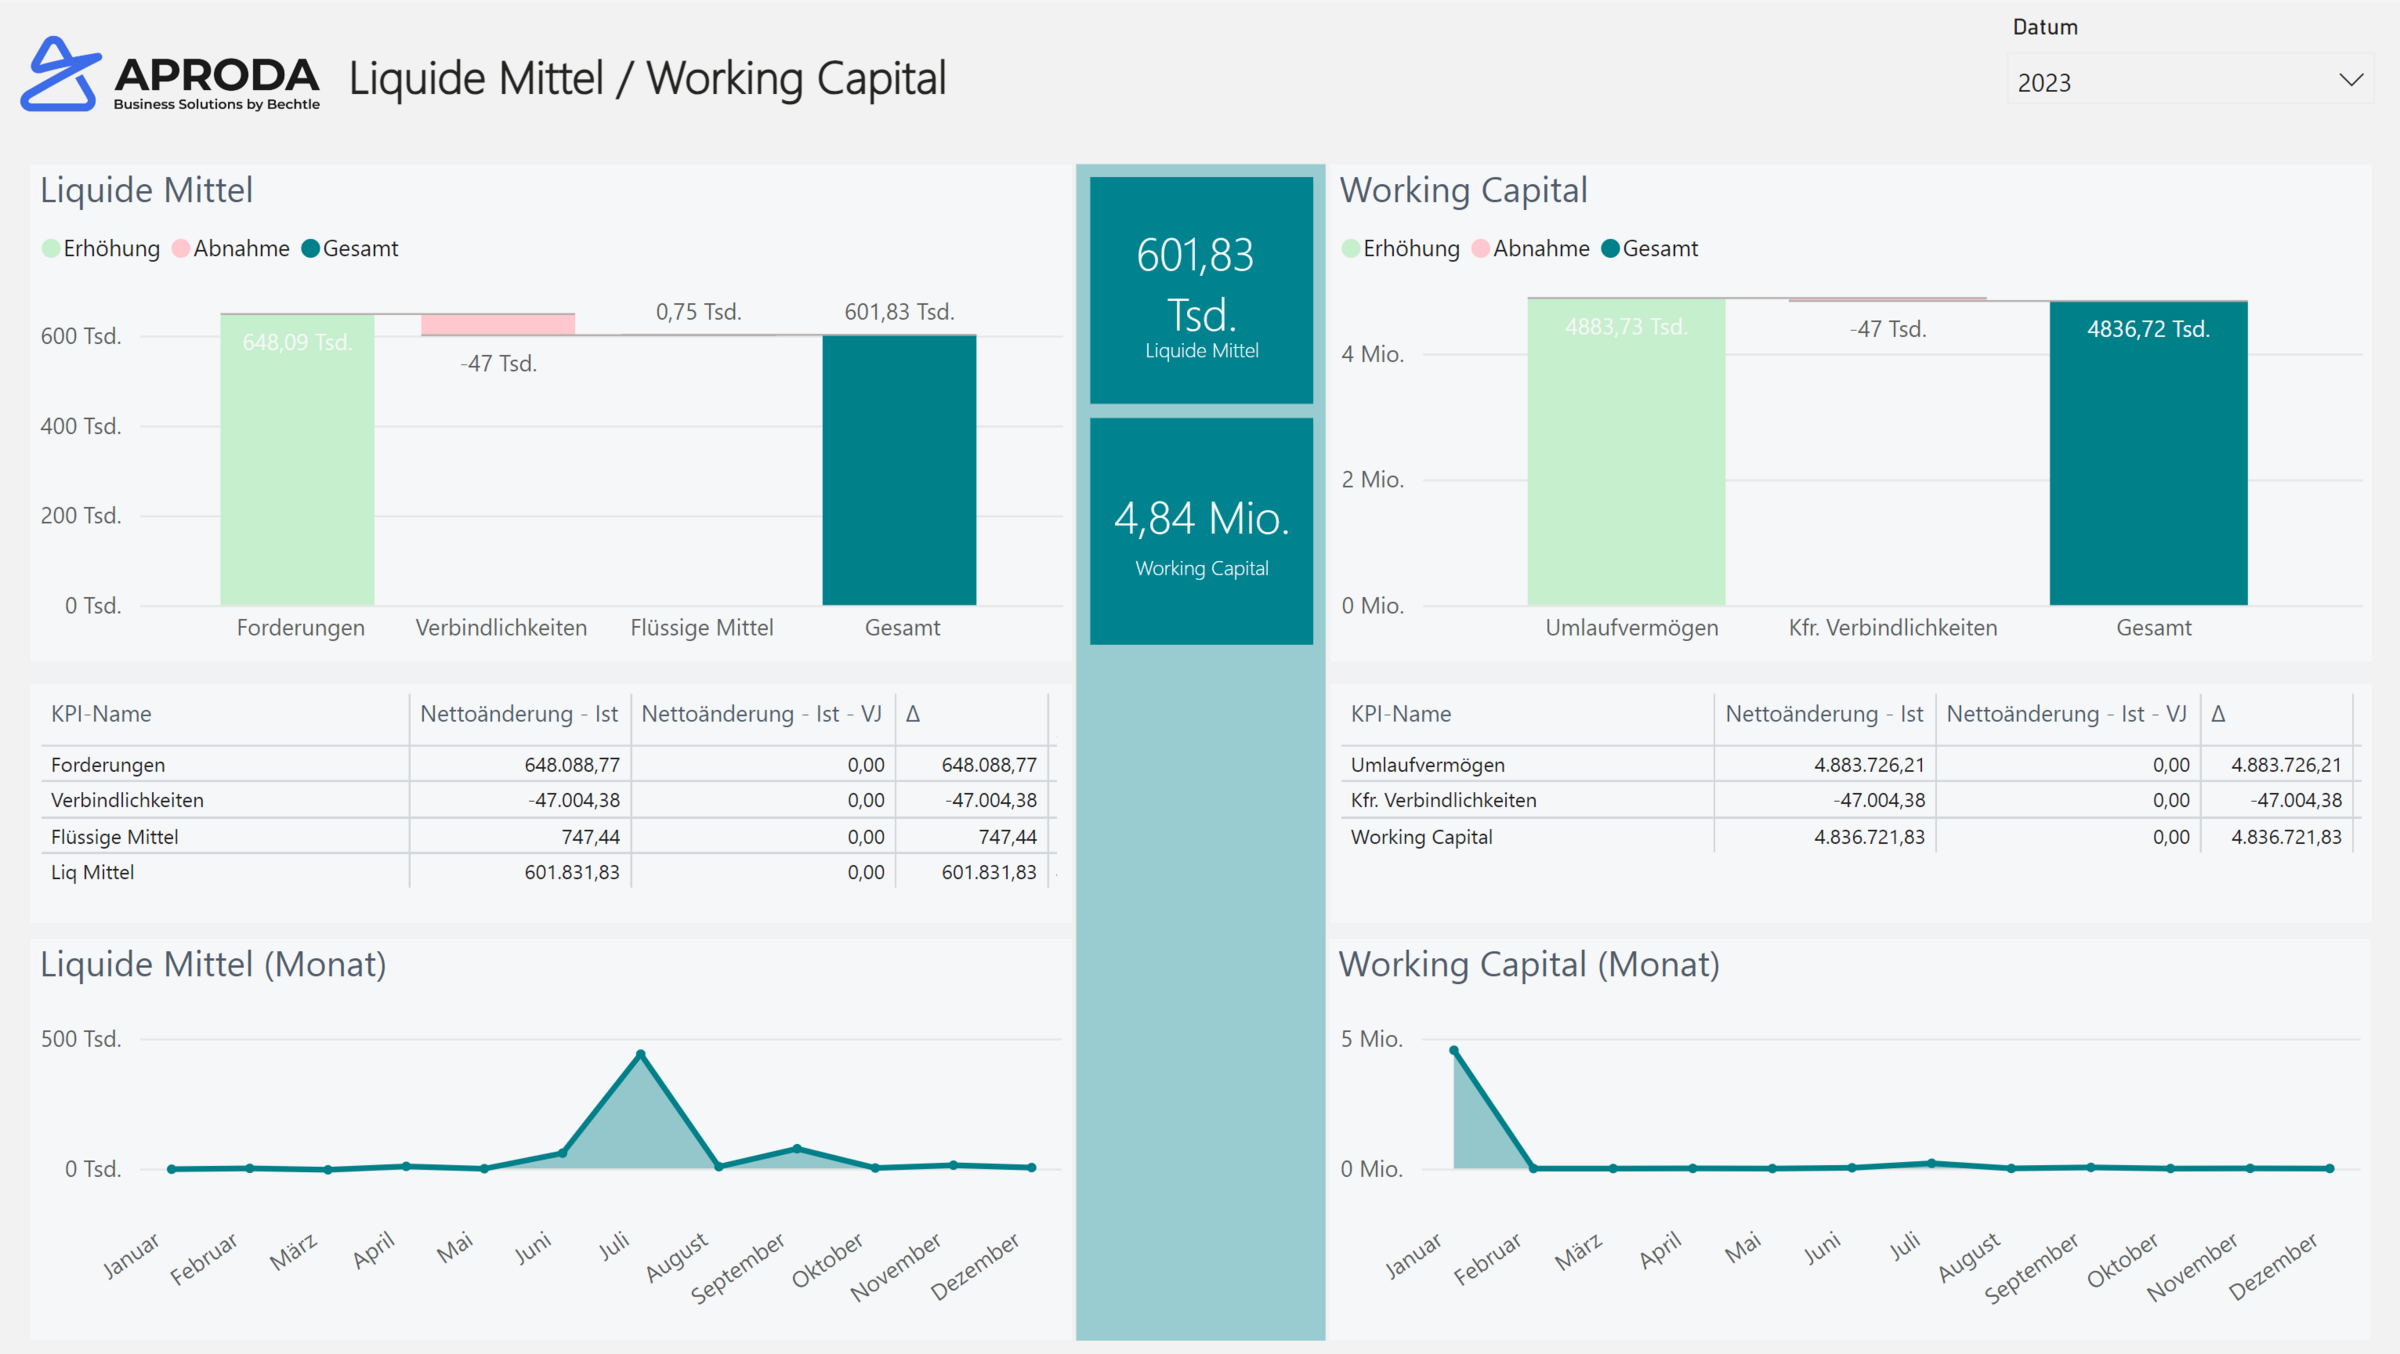
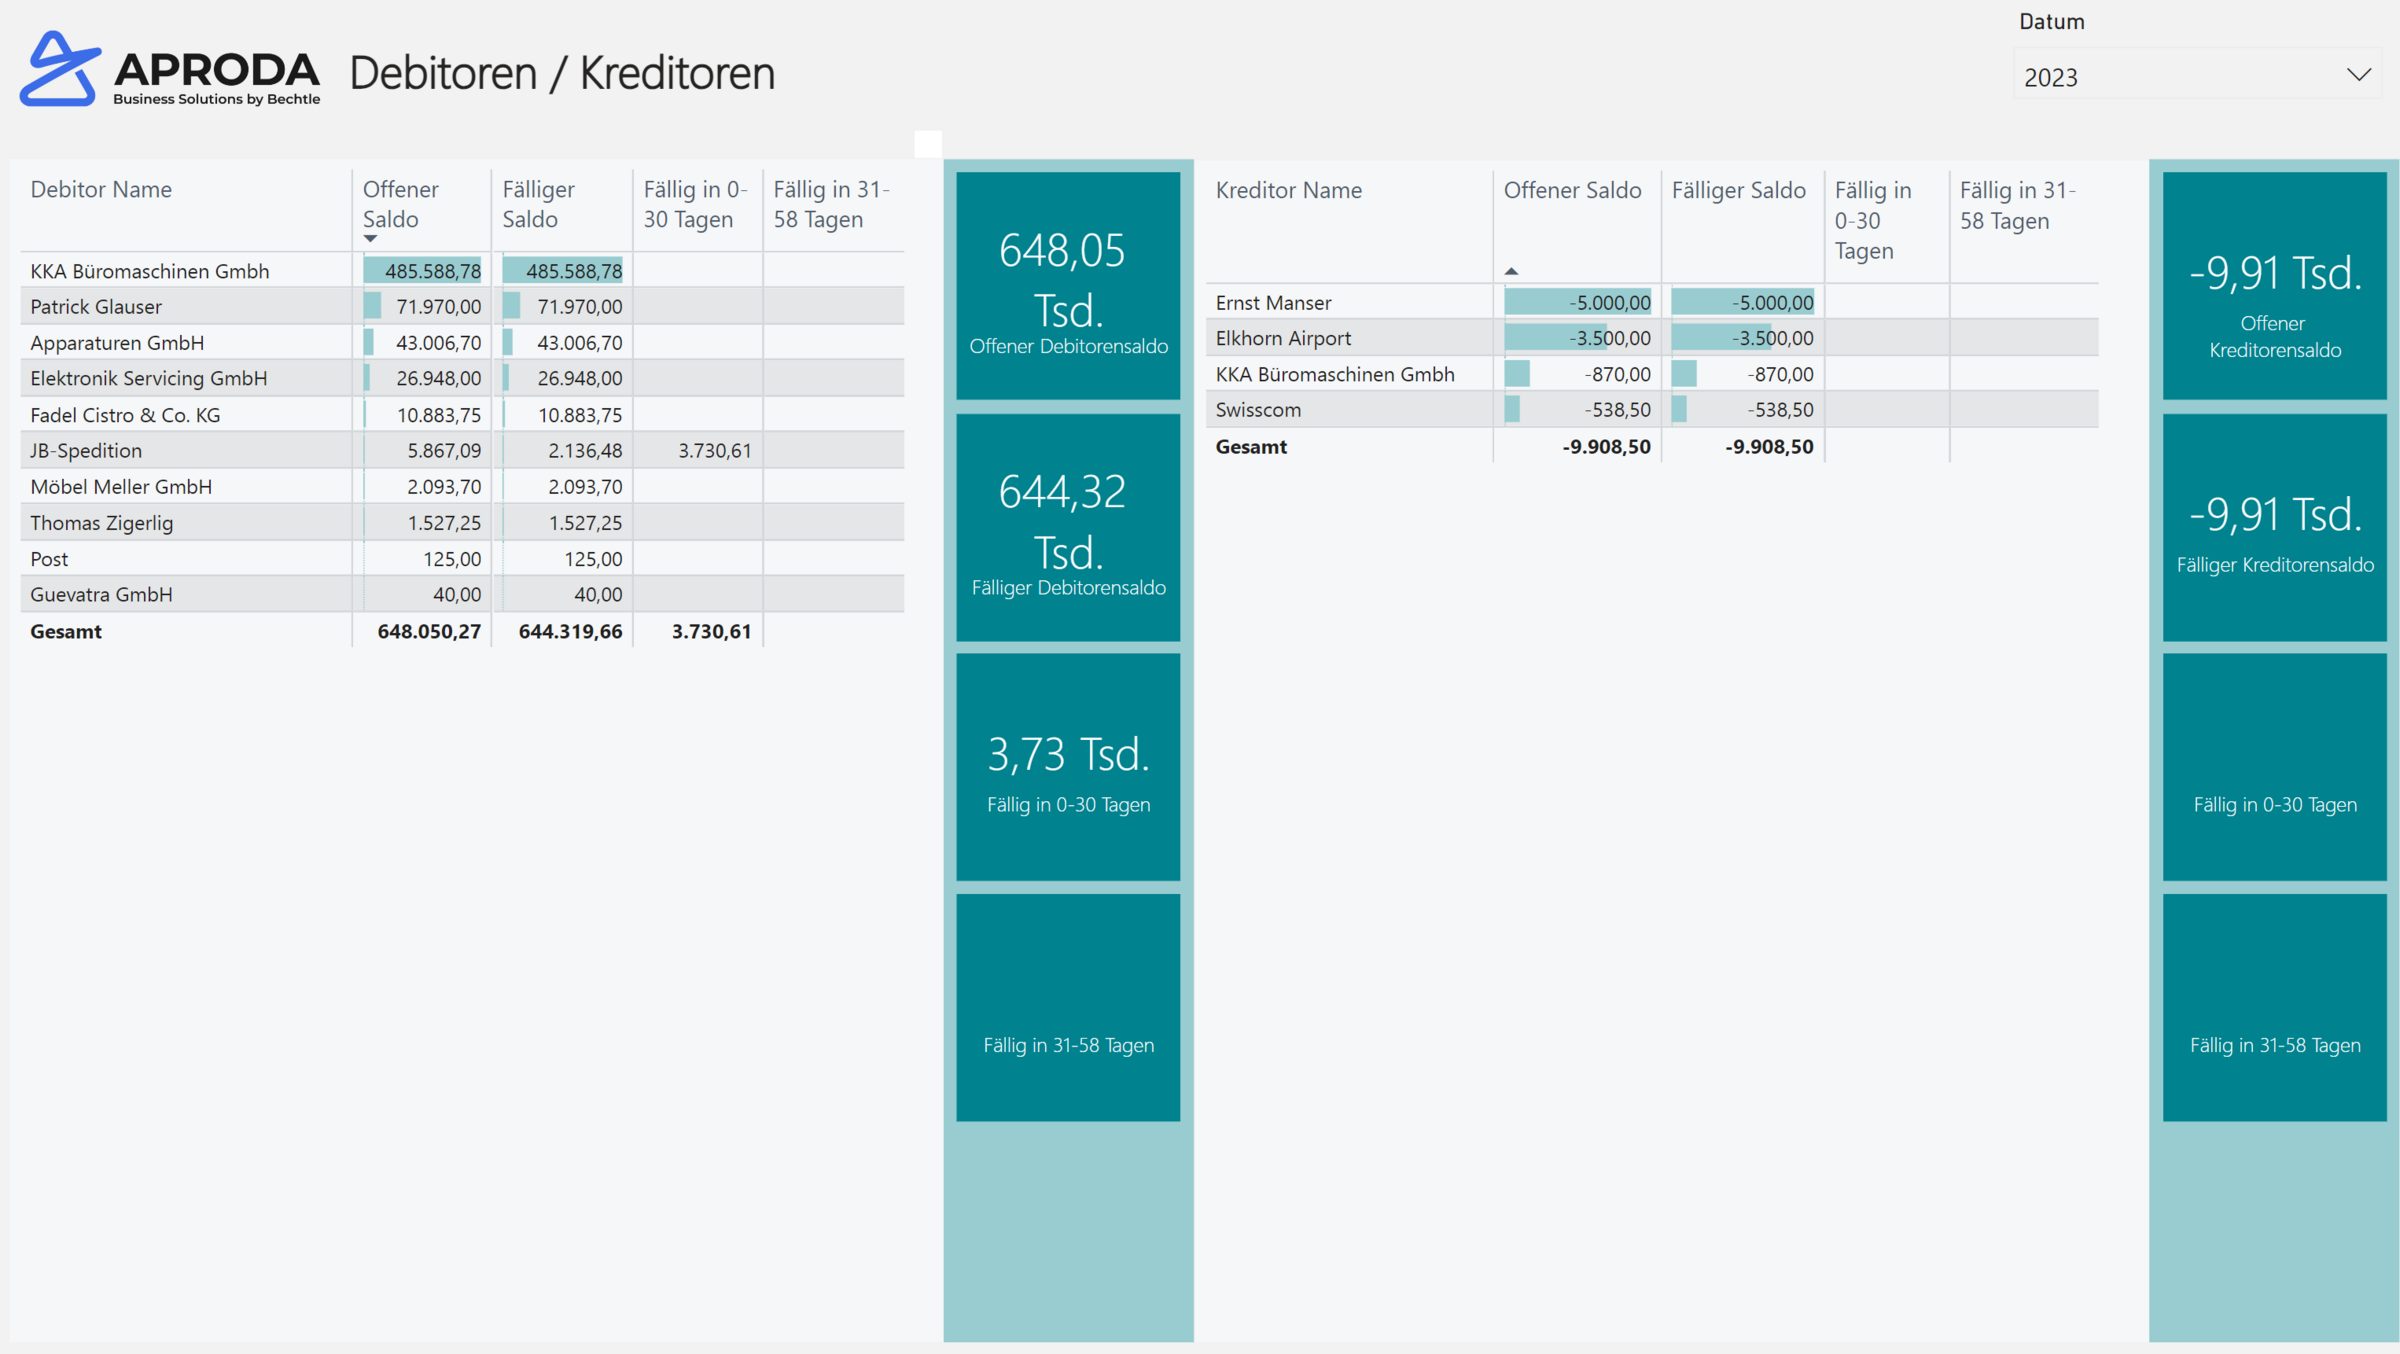
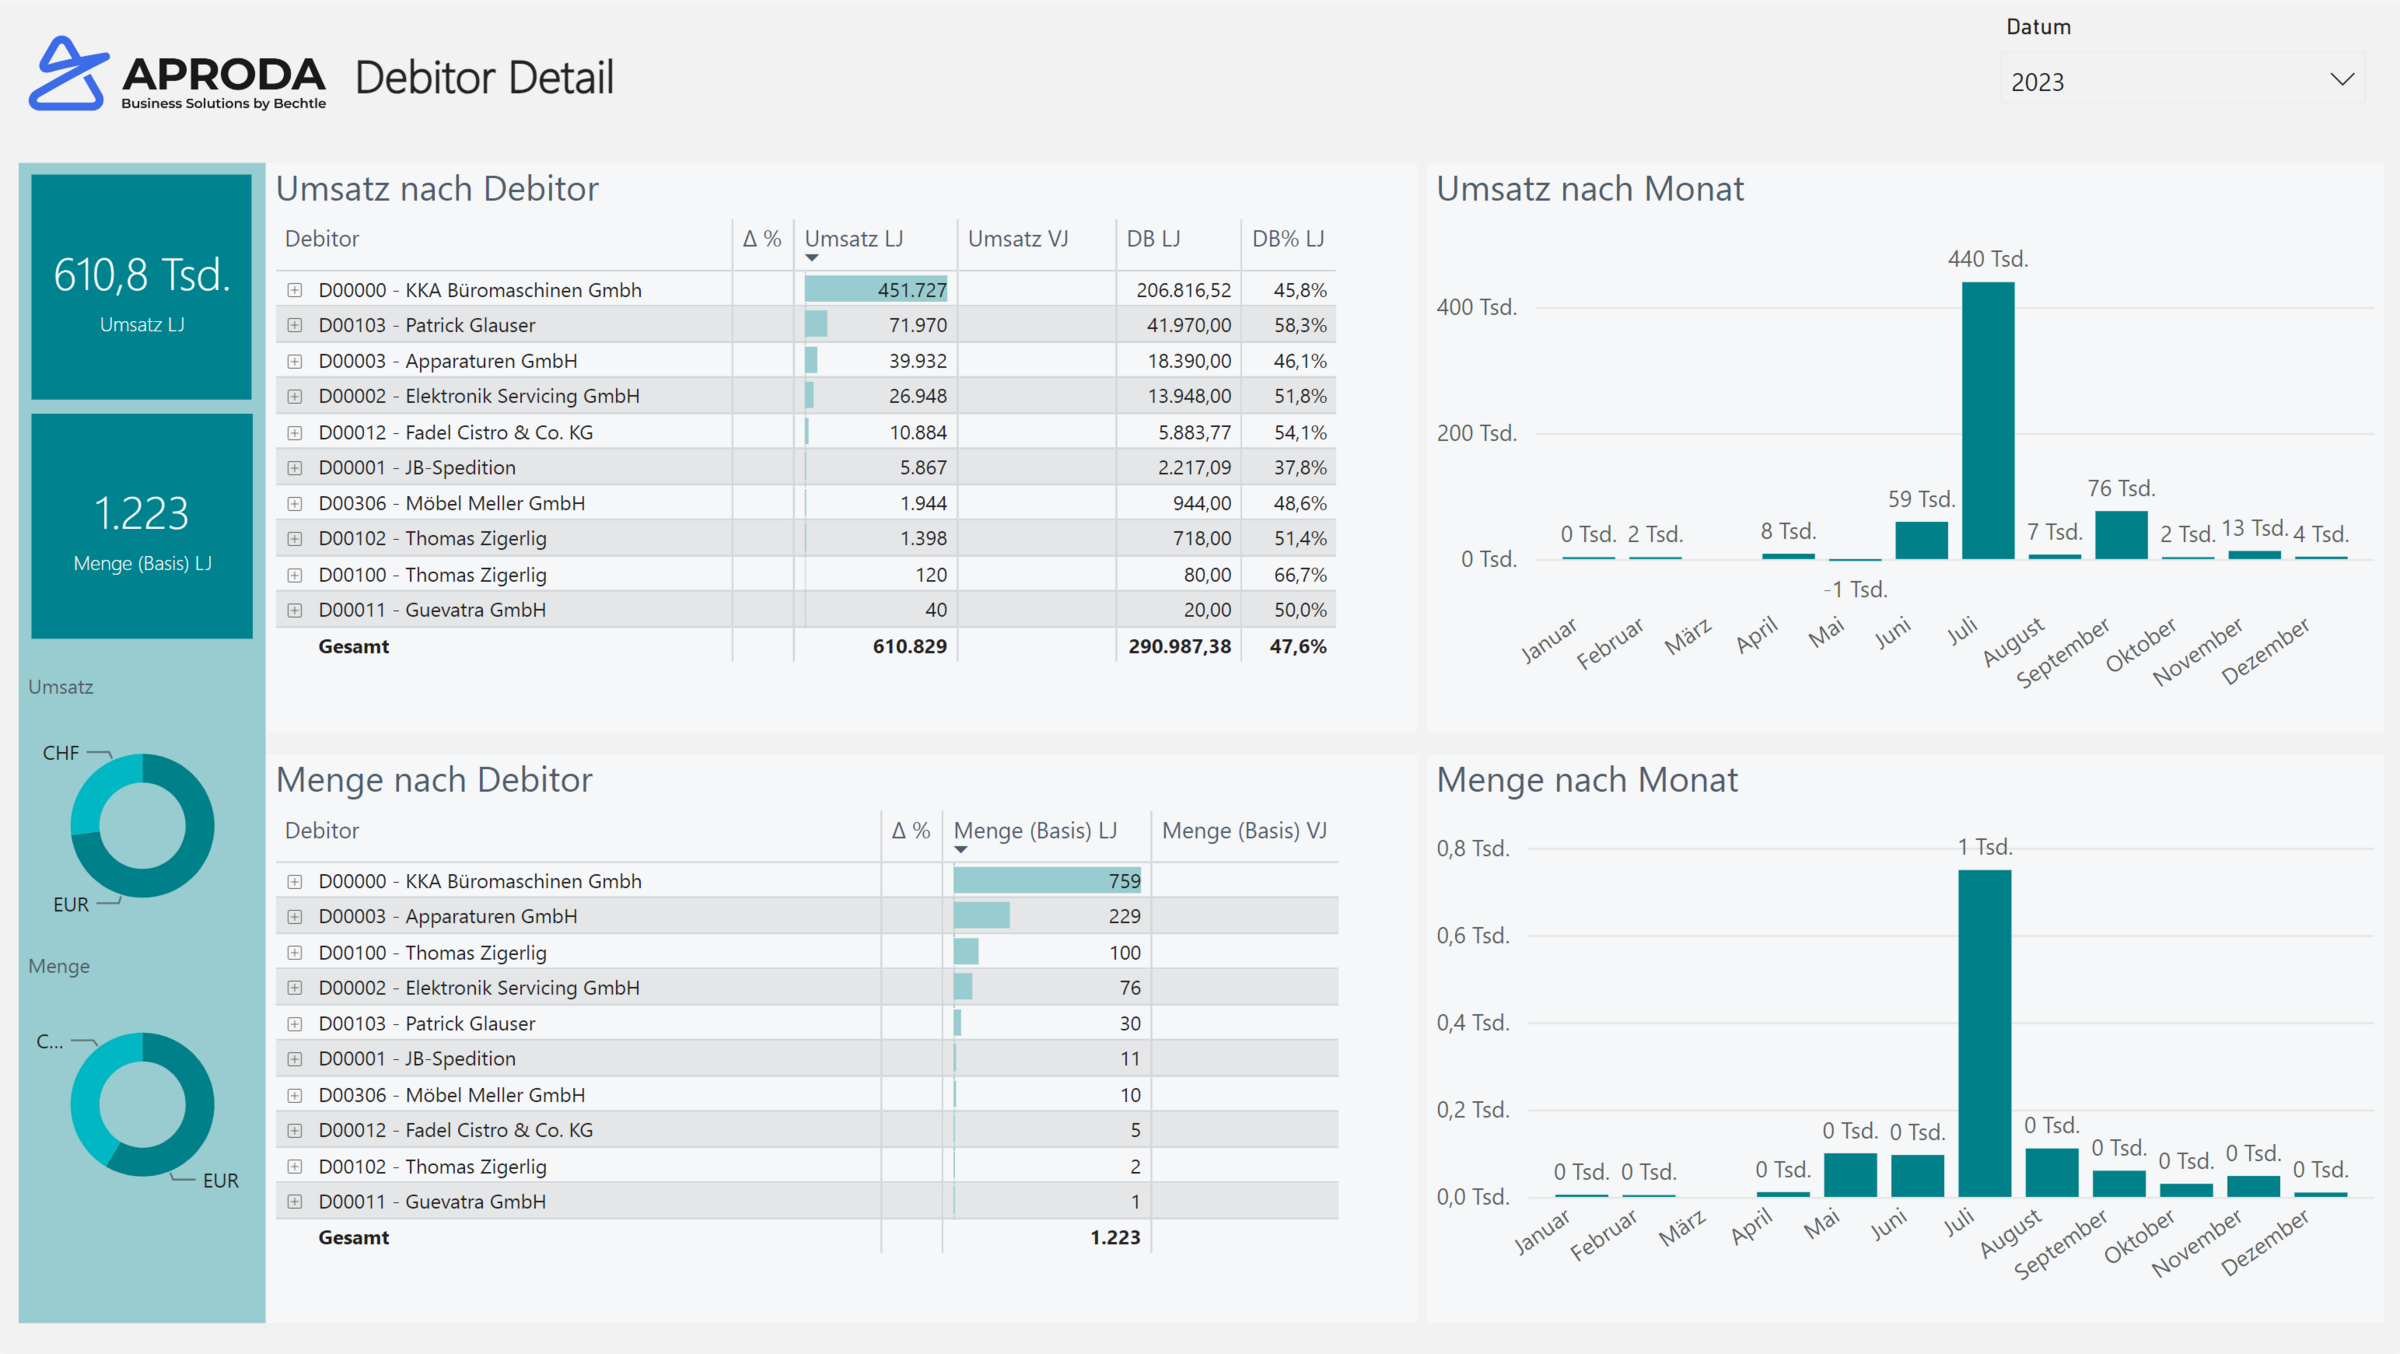
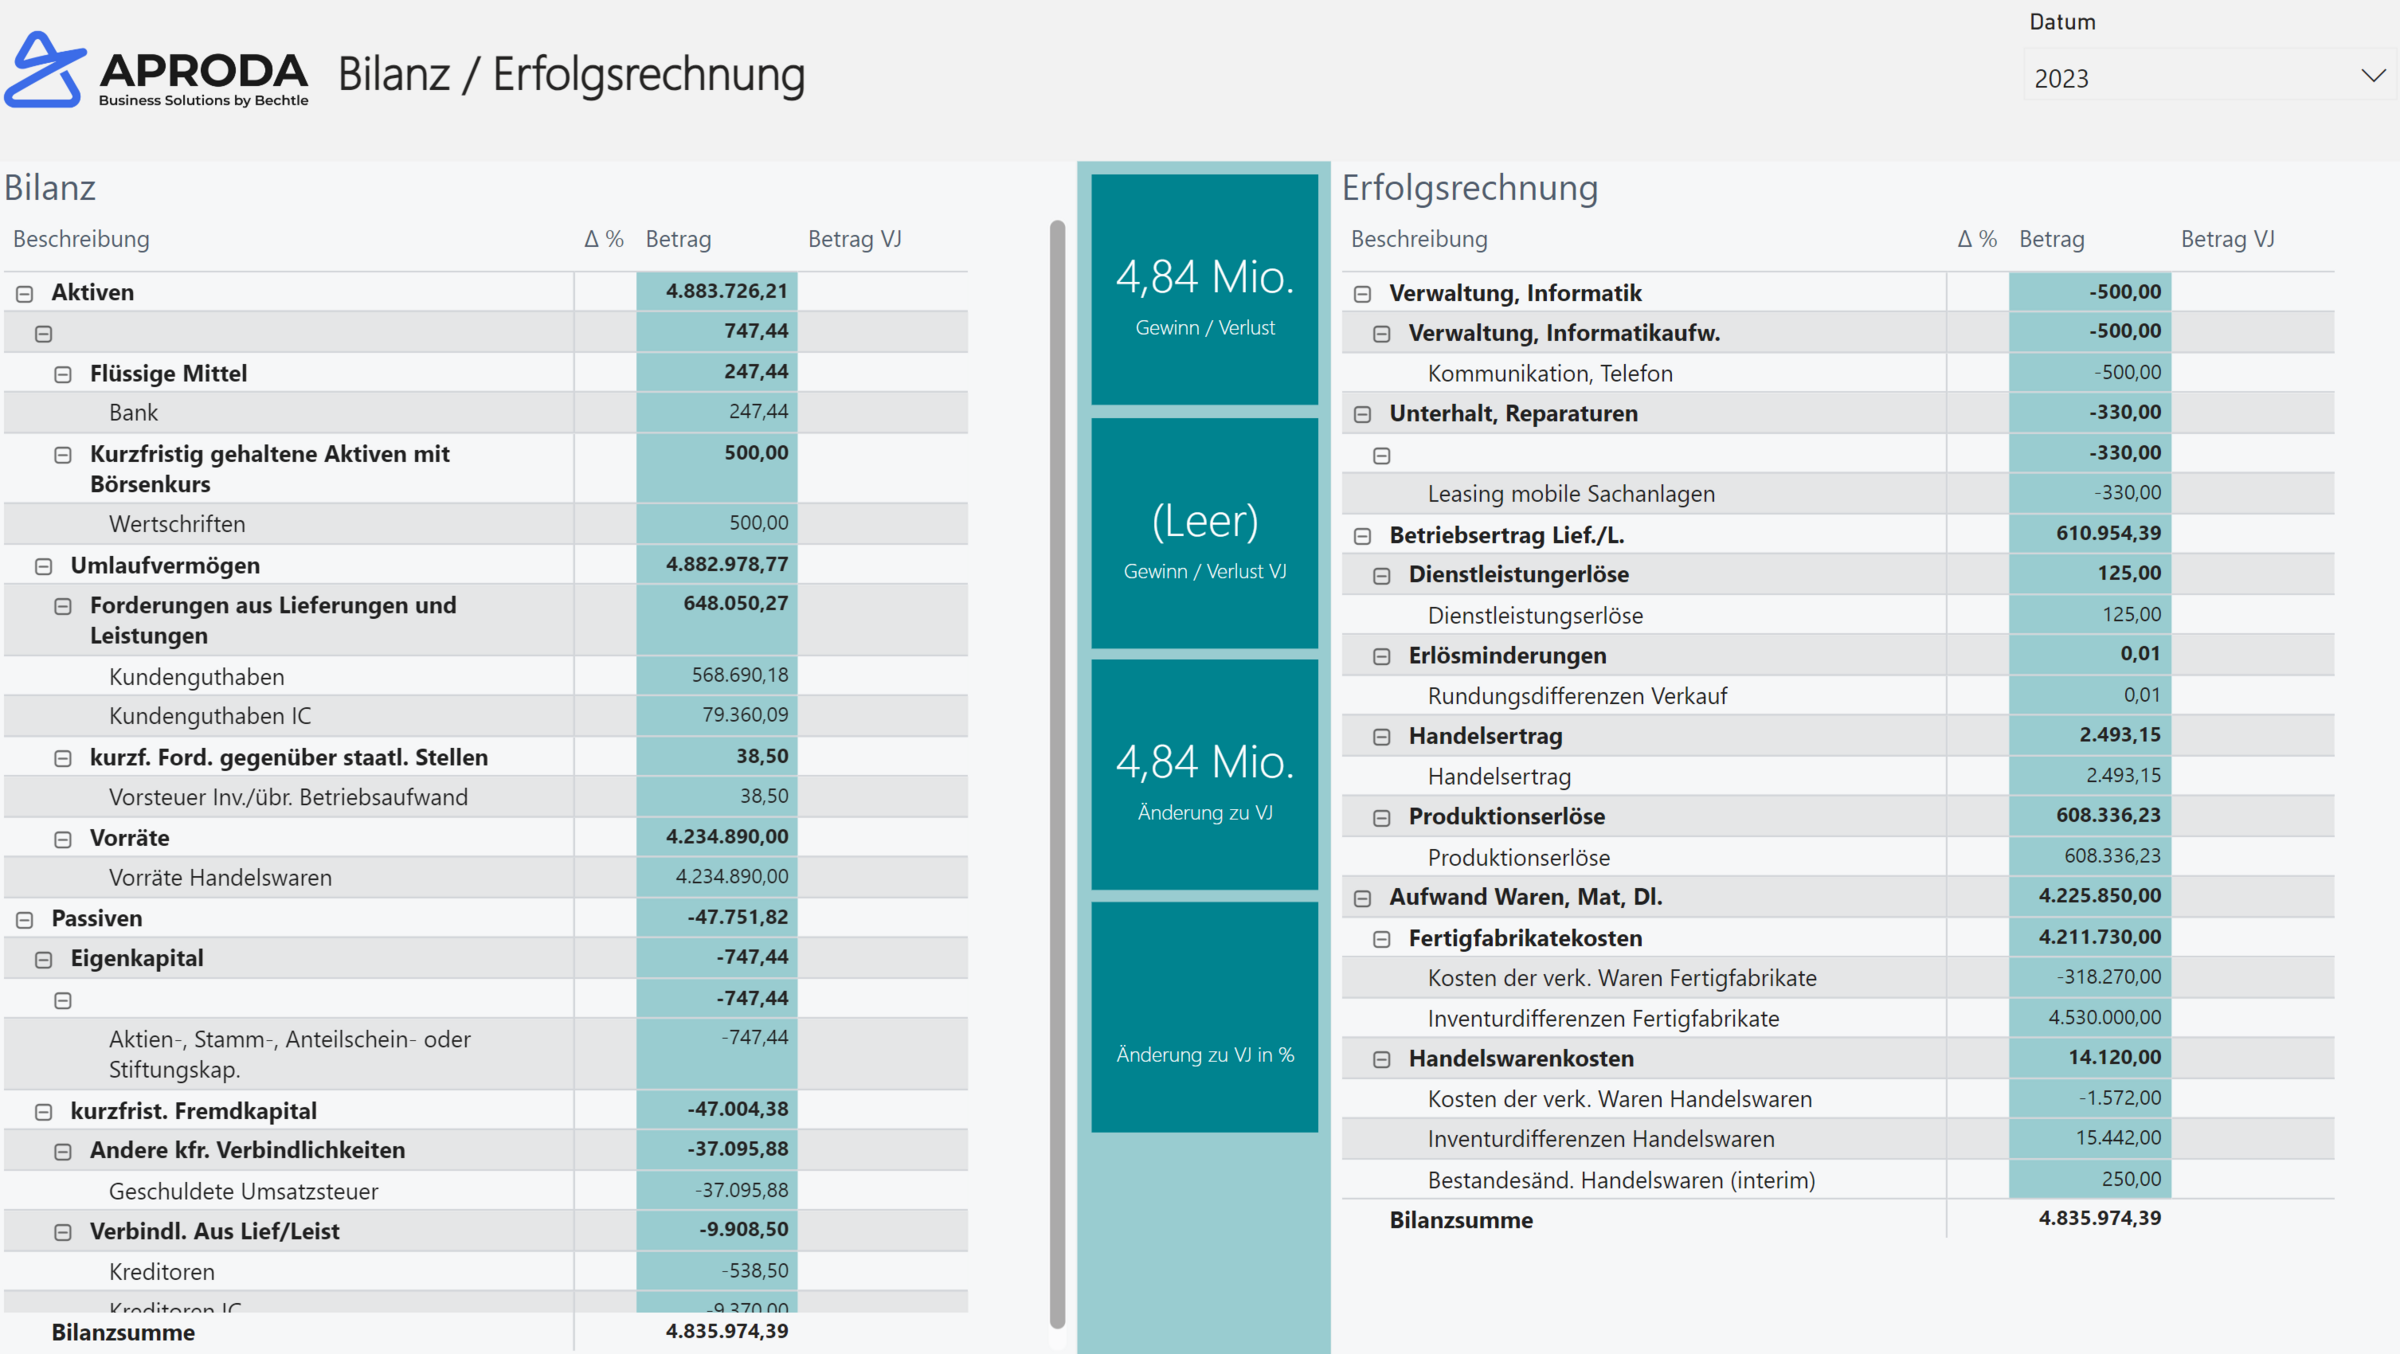
Microsoft PowerBI can be used to analyze all of a company's business processes. This provides your process managers with the basis for efficient controlling and for process and performance optimization:
  • Monitoring of the relevant key figures from the performance processes
  • Overview of product sales, DB calculations, sales volume
  • Presentation of quality standards
  • Monitoring the effectiveness of business processes
  • Creation of personal dashboards and automated reports
  • Recognition of opportunities and risks
  • Company-wide use via the web or on mobile devices
Power BI for Finance

  Easy and fast creation of dashboards an...

Power BI for Finance


Easy and fast creation of dashboards and reports characterizes Microsoft Dynamics and makes the excites every financial specialist and controller.

  • Key figures in real time
  • Drilldown functionality - from the summary to the account level
  • Simplify data analysis and create ad hoc charts
  • Data export to Excel at the push of a button
  • Linking of different data sources - Consolidations
  • Easily create and publish dashboards and reports
  • Dashboards scale across the enterprise and provide built-in control and security


PowerBI for Marketing, Sales & Service

The overview of marketing and sales processes i...

PowerBI for Marketing, Sales & Service

The overview of marketing and sales processes is becoming increasingly important. What is needed are efficient and simple tools that also include aftersales - service:

  • Target monitoring: Marketing and sales dashboards
  • Dashboards with a unique 360° view of the business
  • Service dashboards - Complaint monitoring
  • Linking the purchasing behavior of products and services to customers. E.g. for determining brand loyalty
  • Documenting customer interactions - Monitoring activities
  • Eliciting changes regarding the customer or sales

The right solution for your information needs. MIS - Management Information System

Due to the different needs, we at Aproda AG offer our customers three solution variants in the area of Business Intelligence and Management Information Systems (MIS). These can be combined with each other as required or customized and expanded.

Microsoft Power BI
Why Aproda AG

Since 1983, we have been accompanying SMEs on their way to digitalization by transforming our customers' business processes into state-of-the-art software and system solutions. When it comes to implementing the entire IT of SMEs on time and on budget, we are among the best in Switzerland.

Download company brochure
  • Business & technical consulting 
  • Professional competence of our employees
  • Commitment & experience
  • Quality & availability of our support
600
Customers
150
Employees
40
years of experience
Your contact with us

Patrick Glauser | Head of Sales, Member of the Executive Board

Then I will be very happy to advise you personally. Give me a call: 058 200 14 14 or book a consultation with me directly. I look forward to hearing from you!

Contact us